Memory Forensics With Volatility Tool
Introduction to Memory Analysis
Memory forensics involves the study and analysis of data extracted from the memory (RAM) of a target computer system. This approach focuses on accessing and examining volatile memory contents, which include active processes, open network connections, loaded kernel modules, and other system-related information that is currently stored in RAM. Key aspects of memory forensics include:
-
Acquisition: The process of capturing data from RAM, typically done through memory dumping techniques. This data can also include information from hibernation files or swap space, which are used by the operating system to manage memory when RAM is full.
-
Context Establishment: Identifying and establishing the context within the memory dump by locating key memory offsets. This includes finding critical structures such as process control blocks (PCBs), kernel data structures, and other memory regions that contain valuable forensic artifacts.
-
Analysis of Data: Analyzing the captured memory data to extract significant elements that can provide evidence related to the forensic investigation. This involves reconstructing timelines, identifying user activities, uncovering network connections, and examining artifacts that may indicate malicious activity or unauthorized access.
Memory forensics is crucial in digital investigations because it allows forensic analysts to access real-time and historical information that may not be available through traditional disk-based forensics. It provides insights into the system state at the time of the incident, aids in understanding user behavior, and helps detect and respond to security incidents effectively.
Windows Memory Analysis
IDENTIFY CONTEXT:
-
Kernel Processor Control Region (KPCR): The KPCR is crucial for understanding the low-level details of the processor’s state and is essential for forensic investigations. It contains information about the current CPU, the Interrupt Descriptor Table (IDT), and the Global Descriptor Table (GDT). Identifying the KPCR helps you understand the processor’s current execution context.
-
Kernel Debugger Data Block (KDBG): The KDBG is used by the Windows kernel debugger and provides essential debugging information, including pointers to the loaded module list and process list. Extracting the KDBG can help pinpoint critical system events and the state of kernel data structures.
-
Directory Table Base (DTB): The DTB, or Page Directory Base Register (PDBR), is crucial for translating virtual addresses to physical addresses. This is essential for navigating the memory layout and understanding where processes are located in physical memory.
PARSE MEMORY STRUCTURES:
-
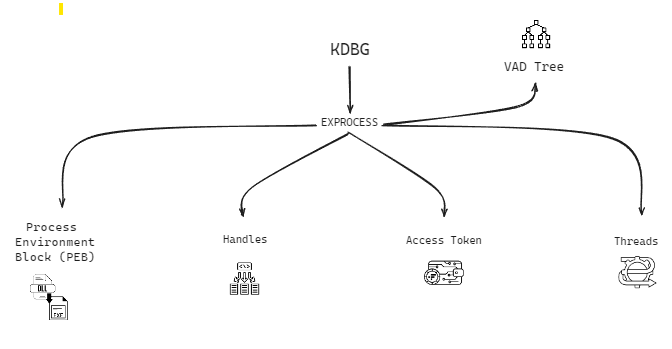
Executive Process (EPROCESS) Block: The EPROCESS block represents each process in Windows. By parsing the EPROCESS, you can extract information such as process ID, parent process ID, and the process’s creation time. This block is the cornerstone of process investigation.
-
Process Environment Block (PEB): The PEB contains crucial information about the process environment, including loaded modules, process parameters, and heaps. Analyzing the PEB helps in understanding the execution environment of a process.
-
DLLs Loaded: DLLs (Dynamic-Link Libraries) are critical components of Windows applications. By enumerating the loaded DLLs, you can identify the dependencies of a process and detect any unusual or malicious DLL injections.
-
Virtual Address Descriptors (VAD) Tree: The VAD tree provides a hierarchical representation of the virtual address space of a process. Parsing the VAD tree helps identify memory regions allocated to a process, including stack, heap, and memory-mapped files.
-
List of Memory Sections Belonging to the Process: By listing memory sections, you can get a detailed view of the memory layout of a process. This includes code, data, and various memory segments which can be scrutinized for anomalies.
-
Kernel Modules/Drivers: Kernel modules and drivers operate at a high privilege level and are often targeted by malware. By analyzing the loaded kernel modules and drivers, you can detect unauthorized or malicious code running in kernel mode.
SCAN FOR OUTLIERS:
-
Unlinked Processes: Unlinked processes are those not connected to the active process list but still residing in memory. These can be indicative of stealthy malware or hidden processes.
-
DLLs, Sockets, and Threads: Identifying outliers among DLLs, sockets, and threads can reveal malicious activities. For instance, unusual DLLs loaded by a legitimate process or unexpected open network connections can be signs of compromise.
-
Unmapped Memory Pages with Execute Privileges: Memory pages that have execute privileges but are not mapped to any process can indicate the presence of shellcode or other malicious code injections.
-
Hook Detection: Hooks are mechanisms by which malware intercept’s function calls or messages. Detecting hooks can uncover rootkits or other sophisticated malware that manipulate system behavior.
-
Known Heuristics and Signatures: Utilizing heuristics and known signatures helps in identifying malware based on predefined patterns and behaviors. This is essential for automated threat detection.
ANALYSIS:
search for anomalies:
- The last stage of the process involves conducting a thorough search for anomalies. This includes cross-referencing parsed data, examining outliers, and correlating findings with established threat intelligence. Through meticulous analysis of memory artifacts, you can reveal concealed malware, rootkits, and other types of malicious activities.
Memory Forensics with Volatility Tool
-
Volatility is an incredibly powerful tool for memory forensics, capable of extracting information from memory images (memory dumps) of Windows, macOS, and Linux systems. It boasts a vast community contributing third-party plugins, enhancing its functionality. Incorporating memory acquisition and analysis into your investigations is crucial, and Volatility should be a staple in your forensic toolkit.
-
In this guide, we demonstrate how to use Volatility 3, from installation to basic commands. Key tasks in memory analysis include listing processes, checking network connections, extracting files, and performing basic Windows Registry analysis. We cover each of these tasks comprehensively. Once you grasp the Volatility 3 command structure and extract basic information, you’ll find that advanced memory analysis builds upon these foundational concepts.
-
With Volatility 3, memory analysis is becoming more accessible and is an excellent source of action-related evidence. If you haven’t yet made memory acquisition a routine part of your investigations, I highly recommend doing so. The wealth of information that resides in memory, which never makes it to disk, makes the extra effort highly worthwhile
FIND THE PATH OF YOUR TARGET MEMORY IMAGE
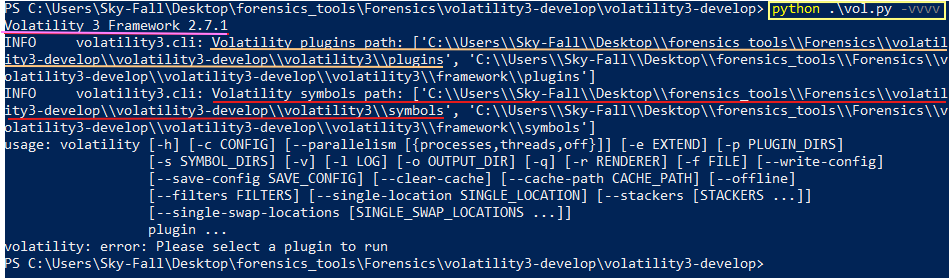
- When executing
python vol.pywithin the Volatility 3 directory, followed by-vto check the version (note the uppercaseVfor Python and lowercasevfor Volatility), several key details are revealed. Firstly, it confirms the presence of the Volatility 3 framework, currently at version 2.7.1, which is newer than the previously available release. Additionally, notable aspects include the symbols path, crucial for downloading symbols used in the analysis, and the designated folder for installing plugins. - Volatility supports numerous separate plugins that can enhance its functionality, making this setup essential for verifying Volatility’s operational status.
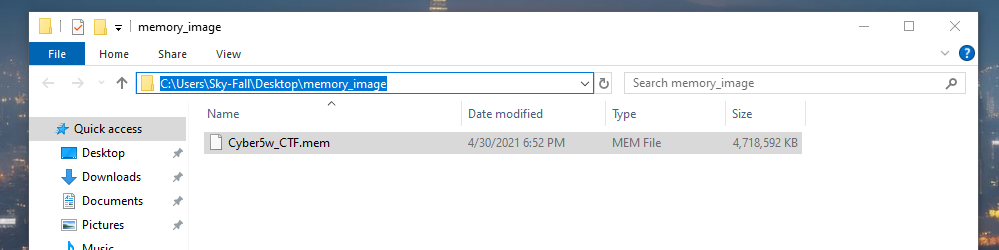
- Next, we need to obtain a memory image. I’ll navigate to a folder on my Desktop named “memory_image,” where I’ll analyze the “Cyber5w_CTF.mem” image file.
GET RAM IMAGE INFO
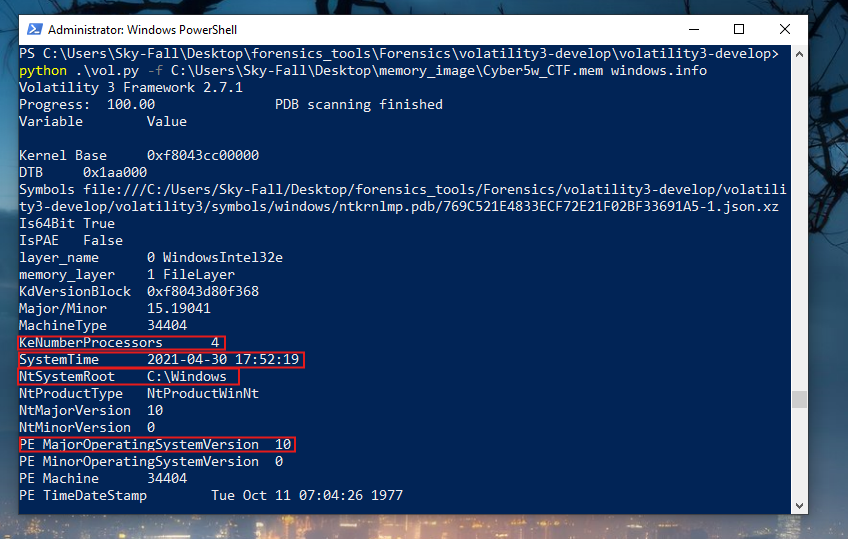
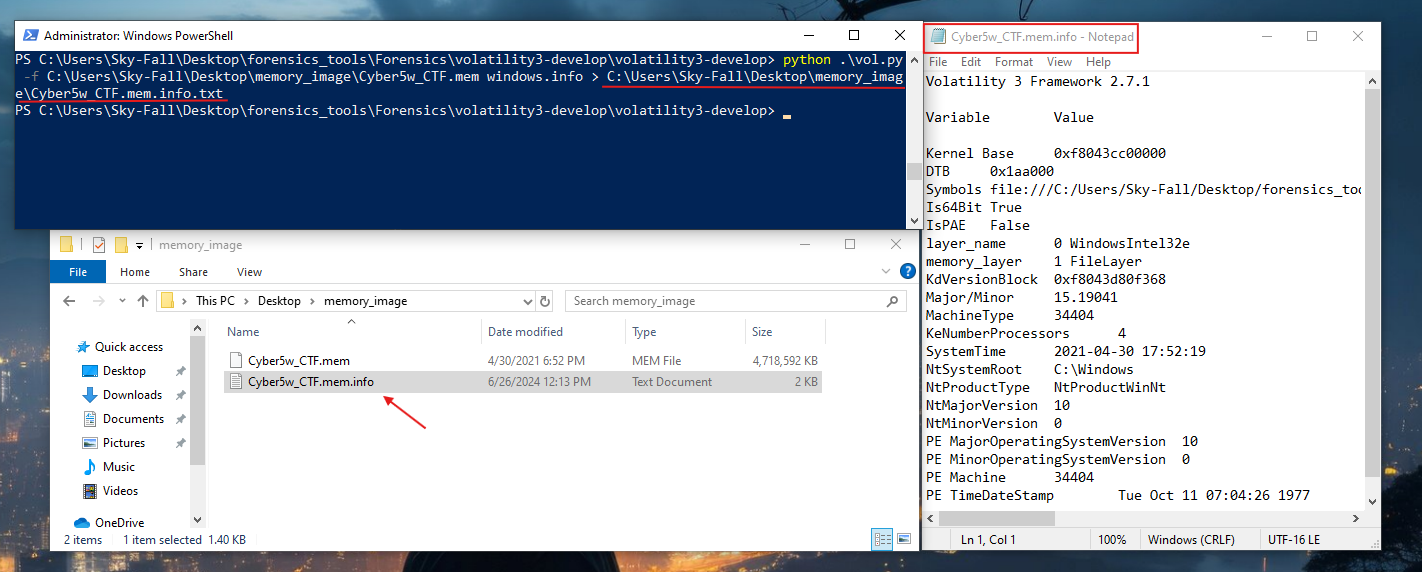
- So, first, I need to locate the directory of my memory image. Then, typically, the initial step involves running the command:
python .\vol.py -f C:\Users\Sky-Fall\Desktop\memory_image\Cyber5w_CTF.mem
- This command specifies the memory image file using the
-foption. Following that, to gather information about this memory image, I’ll execute:windows.infoThis will provide details and insights specific to the memory image being analyzed.

- Volatility 3 operates differently in specifying plugins at the end of the command. For example, when analyzing a Windows memory image and seeking information about the Windows system, the command structure typically involves specifying the plugin at the end. I’ll demonstrate how to use this as a filter shortly. Let’s proceed with running the command.

- Now it’s scanning through the memory image, and this process may take some time. During this scan, we gather basic information directly from memory. For instance, details such as the number of processors, the system time at the moment of imaging, and the system root set to the C drive (Windows) can provide crucial insights for our investigation.
- Major operating system version information and other relevant system attributes are also retrieved in this initial phase. This step typically serves as our starting point in the analysis process.
- If I wanted to run the same command and save the output, I would use a greater-than sign
>to redirect the output to a file named Cyber5w_CTF.mem.info.txt. This allows me to capture and store the information obtained from the command in a text file for future reference or analysis.
LISTING INSTALLED PLUGINS
- If you’re new to using Volatility and you have your memory image, but you’re unsure of what specific commands or plugins to use next, a handy approach is to specify your memory image and then simply enter the plugin name like “windows” without the need to specify the entire command. This approach allows Volatility to execute using default settings for the specified plugin, providing you with relevant information directly.

- If you enter just “windows” after specifying your memory image in Volatility, it will typically result in an error message. However, this error will also display a list of all available commands that can currently be executed on your memory image. This list includes all installed plugins and their respective commands that you can utilize.
- This method allows you to quickly see the range of available options for analyzing a Windows memory image.
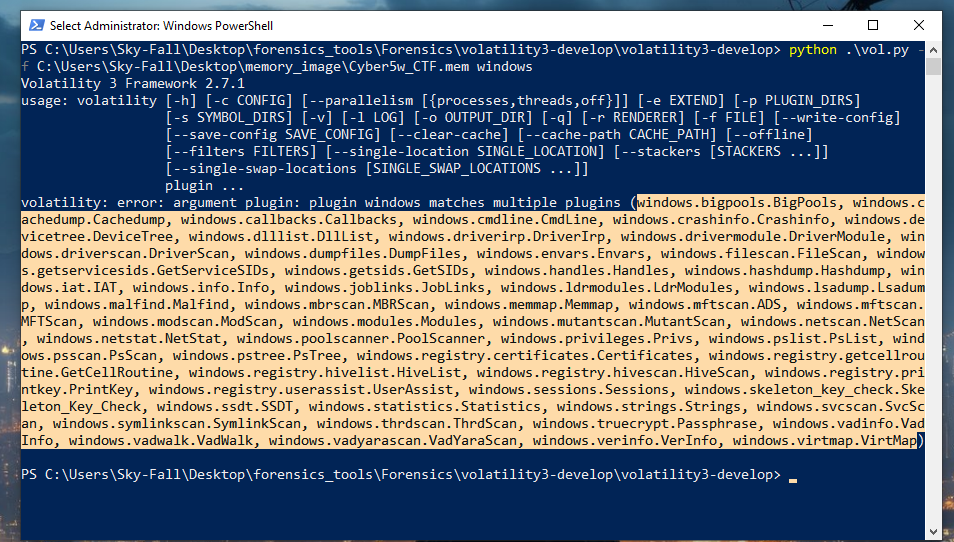
- These are all the different modules that I can run, and for each of these modules, there’s also a help menu available which I’ll demonstrate shortly. For instance, there are modules like windows.mftscan that provide specific functionalities within Volatility.

-
If you encounter a scenario with duplicate module names, Volatility automatically attempts to locate the most relevant submodule. For example, if there’s only one submodule named mftscan under windows, you can simply type
windows.mftscanwithout needing to specify further differentiation. -
However, if there are multiple modules under a parent module like windows.registry, you would need to specify the complete submodule name to avoid ambiguity. For instance, you should type windows.registry.hivescan to distinguish it from
windows.registry.userassist. The key takeaway is that you don’t always have to type out the entire command. Typing the unique module name and letting Volatility autocomplete the rest can save time and prevent errors in more complex scenarios.

GET PROCESS LIST FROM RAM
-
The first step I typically take when analyzing memory is to view a process list using the windows.pslist module. I then pipe this output into more to paginate it in PowerShell on Windows. Although more is traditionally a Linux command, PowerShell supports it as well. This approach allows me to print out all the processes present in the Windows system at the time of imaging without the output scrolling by too quickly. Let’s go ahead and execute this command.
-
When the process list is generated, it can be extensive, and if you use the space bar to paginate, you can view it page by page. Without pagination, the text will scroll rapidly, making it difficult to read.
-
Below, this process list, we can see several details. For example, the process ID (PID) is represented by the number four. The parent process ID (PPID) is zero in this case. The image file name represents the executable’s name. Additional details include the offset where it was found in the memory image, the number of threads currently running, the number of handles (e.g., file handles), creation time, exit time, and file output.
-
I usually focus on the image file name to filter and concentrate on specific programs. The process ID and parent process ID are also important, as are the number of threads and handles. Handles are particularly interesting for understanding what files a process is accessing.
-
For example, the system process has a process ID of four and a parent process ID of zero. This indicates that the system is one of the initial processes started, with subsequent processes started by the system. The registry was opened by process four, and the registry’s process ID is 108. Similarly, sms.exe was opened by process four, with a process ID of 396.
-
This information allows us to reconstruct the sequence of how applications were opened and their parent processes. Knowing the process ID and parent process ID is crucial, as well as the image file name for filtering purposes. Threads and handles provide additional context, especially in user activity analysis. In malware analysis, the focus might differ, but the principles remain the same.
-
To efficiently analyze a large process list, it’s essential to filter the output. You can dump the entire process list and then search through it to find the specific processes of interest.
-
If you’re already interested in a specific process, you can exit the pagination mode by pressing
q. Instead of usingmore, you can utilize PowerShell’s built-in string searcher,Select-String. Note that is not part of Volatility; it simply aids in filtering. -
For example, if you’re interested in anything related to the Chrome browser in the memory image, you would use
Select-String. Here’s how you can do it: First, continue with your Volatility command, like this:
python vol.py -f Cyber5w_CTF.mem pslist
- Since the process list is extensive, you’ll want to filter it. To do this, use a pipe
|, which is typically located above the Enter key, and then use the PowerShell command Select-String. The command needs to be capitalized. Your full command will look like this:
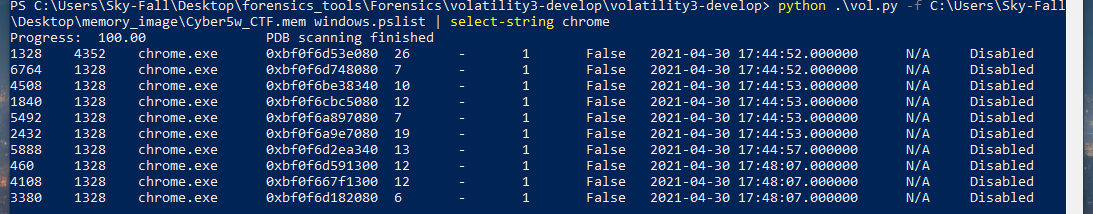
python vol.py -f Cyber5w_CTF.mem pslist | Select-String -Pattern "chrome"
-
This command lists all processes but filters the output to only show lines containing “chrome”.
-
If you were doing this in Linux, you would use a similar command, but instead of Select-String, you would use grep. Here’s how it would look:
python vol.py -f Cyber5w_CTF.mem pslist | grep "chrome" -
By using these commands, you can efficiently filter the process list to focus on Chrome-related entries, making your investigation more targeted and manageable.
-
After pressing enter, you can see that there are still quite a few processes listed, most of which are related to chrome.exe. This allows us to narrow our investigation to chrome.exe. It appears that one of the initial processes is
1328, and the parent ID for all these chrome.exe processes is1328. -
If we want to focus on the parent chrome process, then
1328will be our target. Using Volatility along with filtering tools like Select-String can help you quickly zero in on specific keywords or IDs. The process ID is particularly important as it can be used as a filter in further analysis. This way, we can concentrate our efforts on processes related to chrome.exe and their parent process, making the investigation more efficient and targeted
FIND PROCESS HANDLES
-
Let’s take a look at the files Chrome is currently accessing. Instead of using windows.pslist, we’ll use windows.handles. If you’re unsure how to use the handles command, you can type -h to bring up the help menu for windows.handles.
-
For windows.handles, we can specify a process ID using –pid. If we don’t specify a process ID, it will return all file handles in the memory image, which can be overwhelming. Since we’re focusing on Chrome, and we know its process ID is 1328, we can use that to narrow down the results. Here’s the command:
python vol.py -f Cyber5w_CTF.mem windows.handles --pid 1328
- To handle the large amount of data, we’ll pipe the output into more to view it page by page:
python vol.py -f Cyber5w_CTF.mem windows.handles --pid 1328 | moreThis command will display the file handles for Chrome’s process, making the data more manageable.

-
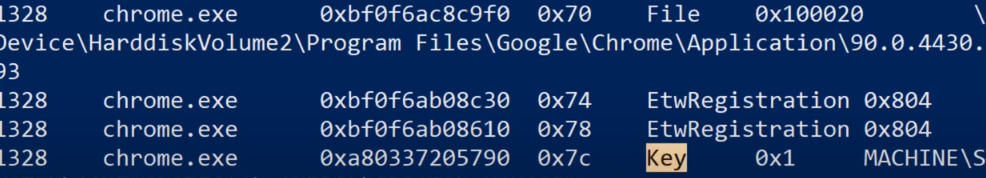
we have the pid we have the process the offset in memory handle value and the type which we’ll use in a second so let’s say that we have these event types.
-
this has a full path to a file and the type is specified as file we also have a key type which is related to the Windows registry so that could be interesting for me as well but for now I’m interested in the file type.
- so I’m going to use the select string keyword again instead of more I’m going to type select string and I’m looking for the file so I’m going to pipe that into more notice that the volatility command is exactly the same I’m printing out all the handles for pid 1328 I’m just filtering based on whether it is a file or not

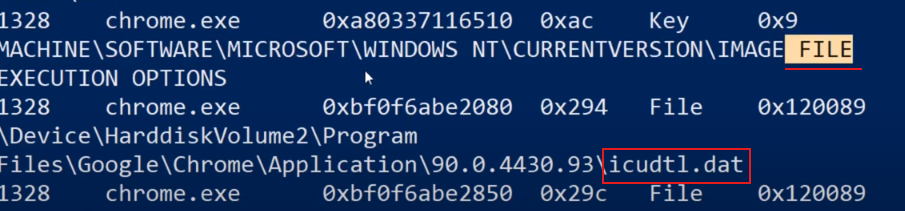
- Here we have our file, and we can see the files that Chrome was accessing. Additionally, we have a registry key because the image file name matched our search query. Among the results, there’s a DAT file, showing all the files that Chrome was accessing.
- Not all of these files are necessarily interesting. We might want to focus on files related to our user, for example, files that include “John Doe”. Alternatively, we could narrow our interest to specific types of files, such as databases. This targeted approach helps us filter out the noise and focus on the most relevant data.

DUMP A SPECIFIC FILE FROM RAM
- Let’s refine our query further by adding another filter. We know that Chrome has a history file, so we’ll search specifically for that. Notice that we’re still using the output from Volatility and haven’t changed the command. We’re just piping it into additional keyword search filters. Here’s how we can do it:
- Use the windows.handles commands with the process ID for Chrome.
- Pipe the output into Select-String to filter out non-file entries.
- A pipe that results in another Select-String to search for “history”.
- Finally, pipe the output into more to handle the large amount of data.
- The full command sequence will look like this:
python vol.py -f Cyber5w_CTF.mem windows.handles --pid 1328 | Select-String -Pattern "File" | Select-String -Pattern "history" | more
- This command will show only those file handles associated with Chrome that have “history” in their name, allowing us to focus on the most relevant data.

-
Let’s see what we get. It looks like our query returned three different files: one is the history journal, another is media history, and the last one is the main history file.
-
By refining our search in this way, we have successfully filtered out irrelevant data and identified specific files related to Chrome’s browsing history.
-
This targeted approach allows us to focus on key files that are likely to be of interest in our investigation.
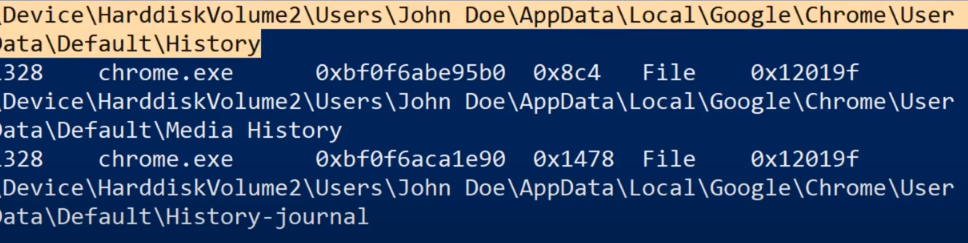
- So actually, this history file looks very interesting if I want to understand John’s Chrome browser history I know that I’m interested in this file and I want to analyze his browser history you take the address specified for this file and then I have my basic volatility command this doesn’t output the file but before I can output the file I need to create an output directory so I’m going to make dir mkdir a folder called dump.

- okay so now I’ve created a folder called dump and that’s where I’m going to save everything that I’m carving out of this memory image we can go back to our volatility command and I need to do -o to specify the output directory I’m going to say save it into the dump folder and then I’m going to use the command windows.
- dumpfile and then I’m going to specify the PID of 1328 which is our chrome process and in that chrome process, I have the virtual address that we just copied..

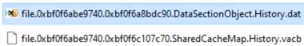
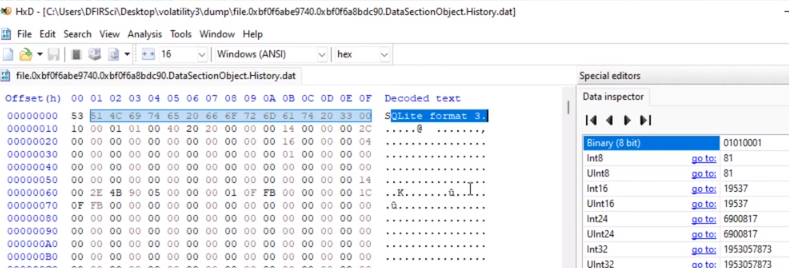
- A file was created the history.dat and we see the history.dat file was created here
- At the beginning of this, we see SQL lite format 3 which means this is a sqlite file probably.
- we see some URLs we see some information so actually this does look like a Chrome history file
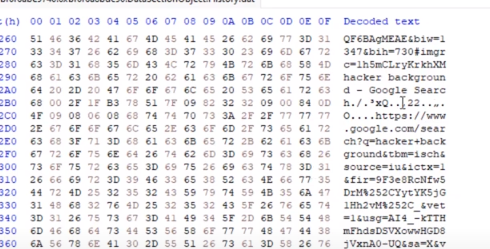
- I’ll now use an SQLite viewer to inspect the file since I know it’s in SQLite format. This is how we pinpoint specific files within a process and directly extract them from memory using the Windows dump file command with our PID, providing the virtual file address and the output directory.
CHECK EXECUTABLE RUN OPTIONS
-
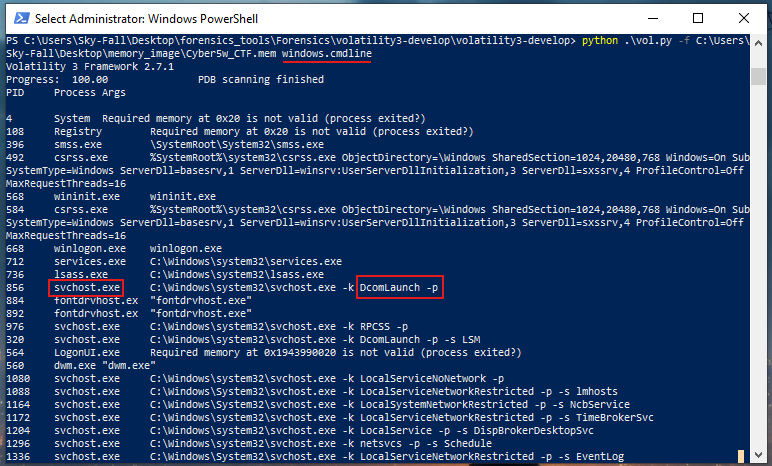
Another interesting command is windows.cmdline.Since this typically produces a lot of data, it’s helpful to pipe it into more to view it page by page. This command shows command line usage, including the switches used when programs were started.
-
For example, while examining the Windows registry, you might see that svchost.exe was run and get the full executable path, but you wouldn’t necessarily see the options it was executed with. If someone runs something from the command line, other tools might only show that the command was executed without detailing the options used.
-
The windows.cmdline command provides a quick way to see what programs have been run, from where they were executed, and any special options that were used during their execution. This detailed view can be crucial for understanding the context and specifics of program executions.
-
Here’s how you can use it:
python vol.py -f Cyber5w_CTF.mem windows.cmdline | more -
This command will display detailed information about the command line usage, including any special switches, making it easier to analyze the behavior and actions taken on the system.
-
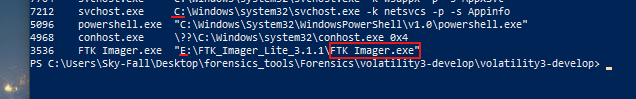
For example, at the very bottom of the output, we can see that FTK Imager was run to create this disk image, and it was executed from the E drive. This is notable because most other programs were run from the C drive, as we would typically expect for system operations. However, in this case, FTK Imager was run from the E drive, and it looks like Imager Lite was used.
-
This detail is interesting because it suggests that the E drive might be an external USB stick or some other external storage device. Identifying the origin of this drive can help us understand more about the context in which FTK Imager was run and why it was necessary to use an external drive. This information can be crucial for forensic analysis, as it might indicate additional sources of data or tools used during the investigation.
-
If we observed a malicious executable being run from the E drive, it might indicate that someone plugged in a USB stick, installed a virus, and then removed the USB stick. This scenario is possible and highlights why checking command line usage can be crucial. It can reveal not only the actions taken but also the context, such as the use of external drives, which might otherwise be overlooked.
-
Next, we might want to explore further commands or methods that can provide more insights into such activities. For instance, examining the following could be helpful:
- Network Connections: Use windows.netscan or windows.netstat to see if there were any unusual or suspicious network connections initiated by the malicious executable.
- File System Activity: Use windows.filescan or windows.malfind to detect any hidden or suspicious files created or modified by the executable.
- User Accounts and Logins: Check windows.getsids or windows.logonsessions to track user activity and identify any unauthorized access.
- Services and Drivers: Use windows.services or windows.modules to check for any malicious services or drivers that might have been installed.
These steps can help build a comprehensive picture of the malicious activity, identify potential entry points, and understand the impact of the intrusion.
FIND ACTIVE NETWORK CONNECTIONS
- Next, something that I pretty much always run along with the process list would be Netstat and it’s going to give me a lot of stuff so I’m going to pipe it into more.

- Here, we obtain the offset within the memory image, the protocol used, the local address of the computer from which this memory image was captured, and the local port. Additionally, we see the foreign or external address being connected to and the foreign port involved in the connection. For instance, if we focus on chrome.exe, we can see the local address it was using and its connection to the external address
185.70.41.35.
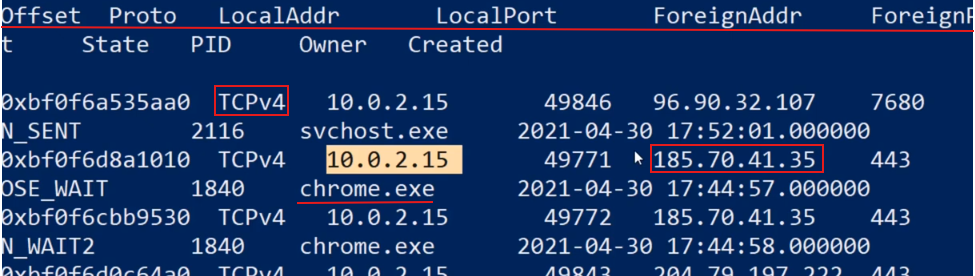
- Now, by performing a quick search, we discover that the address 185.70.41.35 belongs to Proton AG, which is associated with ProtonMail (protonmail.ch). This information reveals that the user was either connected to ProtonMail at the time of imaging or had just closed the connection. Consequently, ProtonMail becomes a point of interest in our case due to this established connection.
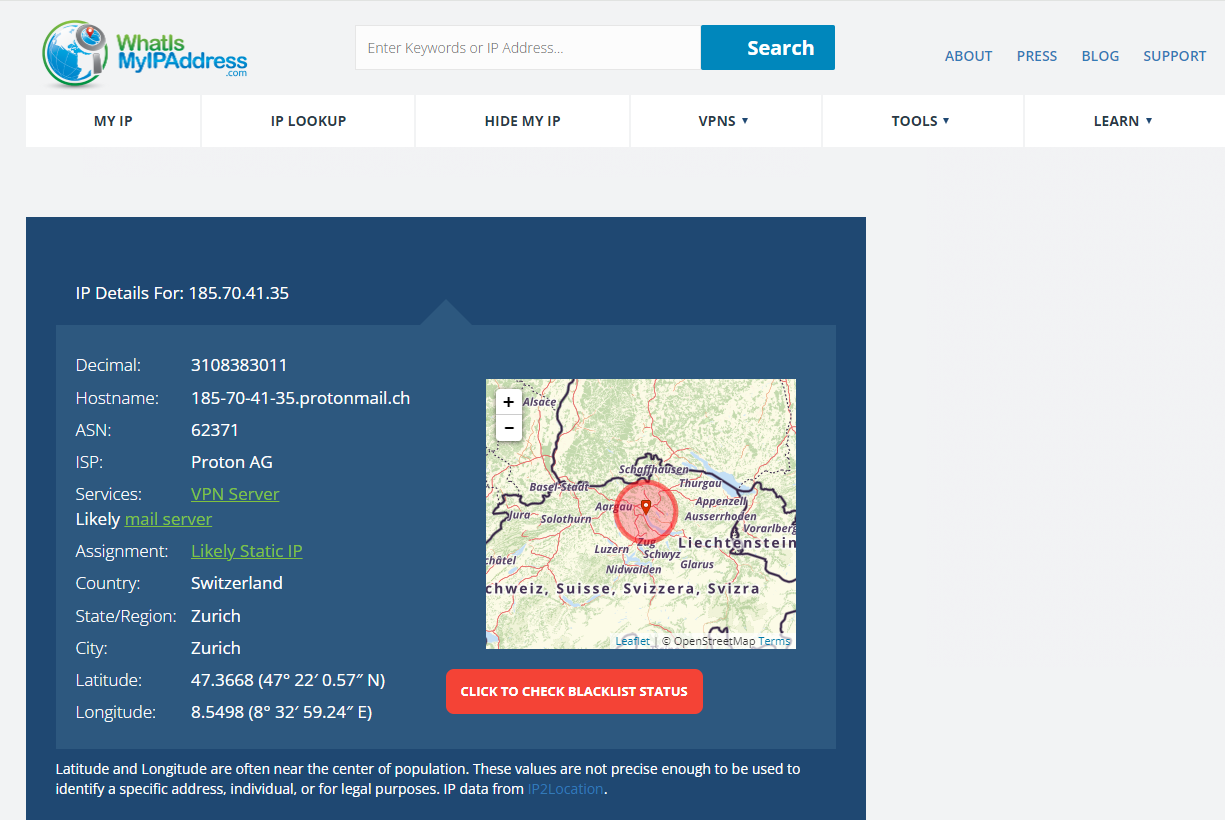
- We can go through and check all these IP addresses to see where they are connecting, which might reveal crucial information. For instance, it can help us identify if any malware was installed and how it was calling back to its source, or it might provide insights into user activities. For example, we already know that one address belongs to ProtonMail, and most of these connections are likely related to Chrome accessing ProtonMail. This investigation can uncover more details about the nature and purpose of these connections.

-
To thoroughly investigate network connections, we also need to know the name of the process and its process ID. This allows us to cross-reference the process list to see what is running, what it is connecting to, what files it is opening, and what kind of network connections it is making.
-
For example, if I’m only interested in chrome.exe, I can use a similar approach to filter out everything else. Here’s how you can do it:
- Find Network Connections: Use Volatility to list network connections and include process details.
python vol.py -f memory_dump.raw windows.netstat - Filter for Chrome: Use PowerShell’s Select-String to filter the output for Chrome.
python vol.py -f memory_dump.raw windows.netstat | Select-String chrome
-
This command will help you focus only on network connections related to chrome.exe. You’ll get details such as the local and foreign addresses it is connected to, which is useful for understanding its network activity.
-
By focusing your investigation on specific processes like Chrome, you can better track user activities, identify suspicious connections, and pinpoint potentially malicious behaviors. This targeted approach makes it easier to analyze relevant data and draw meaningful conclusions from the network connections.
FIND LOCAL USER PASSWORD HASH
- Another useful technique, particularly when investigating a specific suspect and aiming to understand their password usage across different systems, is to perform a hashdump. This process involves extracting and outputting the password hash values from the Windows system. Once we obtain these hash values, our next step would typically involve attempting to crack them to recover the user’s password.
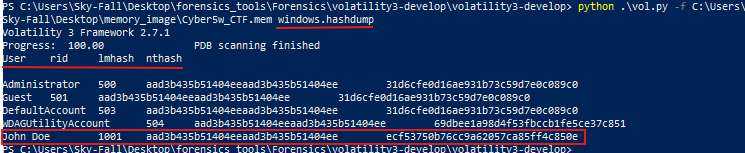
- So, for instance, if we obtain John Doe’s password hash, cracking it could reveal whether the same password is used across other systems. It might also provide insights into the user’s password creation patterns. Accessing these passwords could potentially grant us entry into additional local systems if the password is reused. Furthermore, discovering these passwords may unveil access to online accounts. Therefore, performing a hash dump, retrieving the password hash, and attempting to crack it are critical steps that can significantly enhance our investigation by uncovering valuable data.
ANALYZE USER ACTIONS
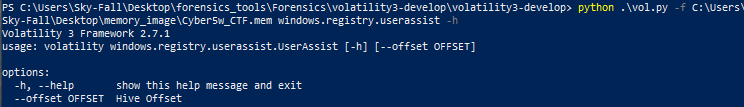
- Another tool I frequently rely on for Windows analysis is the Windows Registry, particularly the UserAssist feature. By using registry.userassist, I can delve into this area to uncover significant insights. When using this command, I typically include -h to review available options. These options may include specifying a hive offset to narrow down the focus or omitting it to display all entries within UserAssist. This approach allows me to thoroughly examine user activity records stored in the registry, providing crucial details for forensic investigations and understanding user behavior on the system.
- So, I’m just going to run this again with more

-
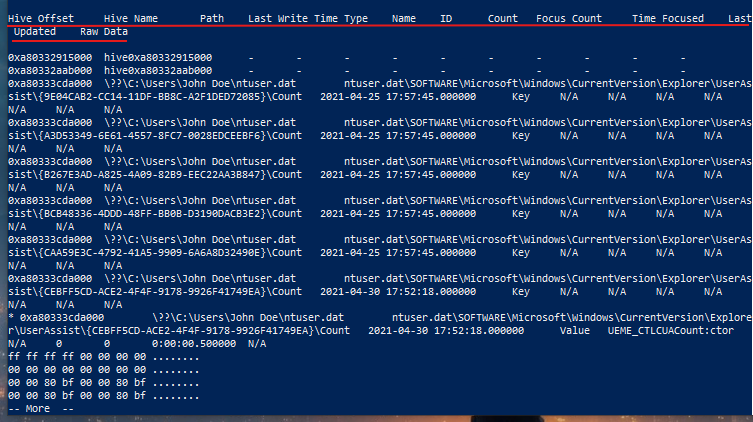
The UserAssist feature provides valuable insights into user activities on the system. It includes details such as the hive offset, hive name, and last write time, which indicates the most recent action related to that registry key.
-
For instance, if it pertains to a program, this timestamp might signify the last time the user executed that program. Additionally, UserAssist records the count, indicating how many times the program was launched, the focus count, which tracks how often the user interacted with that specific program window, and the time focused, representing the total duration the user spent focused on the program over time, not just in a single session.
-
While these metrics—count, focus count, and time focused—may not always be perfectly accurate, they can still establish patterns, such as when the user opens a program and engages with it for a certain period. This information provides significant context for understanding user behavior and their interactions with various programs on the system.
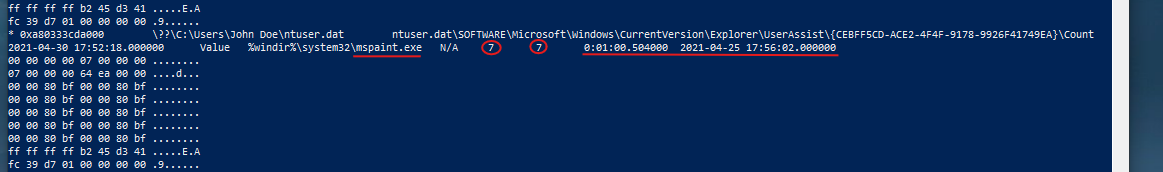
- Let’s explore an example: here we can see that mspaint.exe was executed seven times, had a focus count of seven instances, and accumulated a total focus time of approximately one minute. This indicates that while mspaint.exe was launched multiple times, it wasn’t actively used extensively during those instances.
- Here’s another example: Microsoft Edge, the browser, was opened three times, with a focus count of 16 instances, indicating that the user switched away from the browser and returned to it multiple times. The total focus time accumulated to about 1 hour, 50 minutes, and 56 seconds.
- This information confirms that the user actively used Microsoft Edge, engaging with it intermittently over a significant duration. While these metrics may not be perfectly precise, they provide a solid foundation for analysis and understanding user interactions with the browser.

-
There’s a wealth of advanced functionality within Volatility, including numerous plugins that extend its capabilities further. However, mastering essential tasks such as listing processes, examining network connections, dumping files, and analyzing the Windows registry provides a strong foundation for using Volatility effectively.
-
Once you become familiar with the command structure and workflows, navigating Volatility and leveraging its advanced features will become more intuitive and straightforward. This foundational knowledge forms the basis for conducting thorough memory forensics and extracting valuable insights from memory images during forensic investigations.