Visibility Heatmap
Building on the Attacker Heat Map
After understanding how an Attacker-Heatmap helps visualize threat actor behavior across different MITRE ATT&CK techniques, the next step is developing a visibility-Heatmap.
While the attacker heat map focuses on what the threat actor does, the visibility heat map focuses on what you can actually see and detect in your environment.
It highlights where your current detections are strong, weak, or completely missing, helping identify blind spots in your defensive coverage.
From there, prioritization becomes essential. Not every technique carries the same risk, so security teams must decide which techniques to improve first based on threat intelligence and detection gaps.
Data Sources
we will assume we collect the data-source from the client and work with this data source to complete the example on it.
Data Source                              Platform(s)

-----------------------------------------------------------------------------------------------------------------

Command Execution                        Linux, Windows

Process Creation                         Linux, Windows

File Creation                            Linux, Windows

Network Traffic Flow                     Network

Windows Registry Key Modification        Windows

Network Connection Creation              Linux, Windows, Network

File Access                              Linux, Network, Windows

Web [DeTT&CT data source]                Windows, Linux, Network

Logon Session Creation                   Linux, Windows

Script Execution                         Windows

User Account Authentication              Linux, Windows

Windows Registry Key Creation            Windows

Process Access                           Linux, Windows

Internal DNS [DeTT&CT data source]       Windows, Linux, Network

Active Directory Object Modification     Windows

User Account Modification                Linux, Windows

File Deletion                            Linux, Network, Windows

Service Creation                         Linux, Windows

Logon Session Metadata                   Linux, Windows

Service Metadata                         Linux, Windows

Windows Registry Key Access              Windows

Active Directory Credential Request      Windows

User Account Creation                    Linux, Windows

Scheduled Job Creation                   Linux, Windows

WMI Creation                             Windows

Active Directory Object Creation         Windows

Service Modification                     Linux, Windows

Group Enumeration                        Windows

Network Share Access                     Linux, Windows

Firewall Rule Modification               Linux, Windows

Windows Registry Key Deletion            Windows

Drive Creation                           Linux, Windows

Active Directory Object Access            Windows,

Scheduled Job Modification               Linux, Windows

Firewall Disable                         Linux, Windows

User Account Deletion                    Linux, Windows

Process Termination                      Linux, Windows

Scheduled Job Metadata                   Linux, Windows

Active Directory Object Deletion         Windows

Group Modification                       Windows

Firewall Enumeration                     Linux, Windows
what’s DeTT&CT tool and how we can Install it
DeTT&CT is a framework used to map collected telemetry (data sources) to MITRE ATT&CK techniques, helping identify coverage and detection gaps.
we can just use the following lines two download and install:
git clone https://github.com/rabobank-cdc/DeTTECT
pip3 install -r requirements.txt
Also, consider that you can open the editor locally by the python tool using the following command:
python3 dettect.py editor
Prepare data for DeTT&CT
We’ll transform the client’s collected data source table into a data-sources-new.yaml file using the DeTT&CT Editor interface.
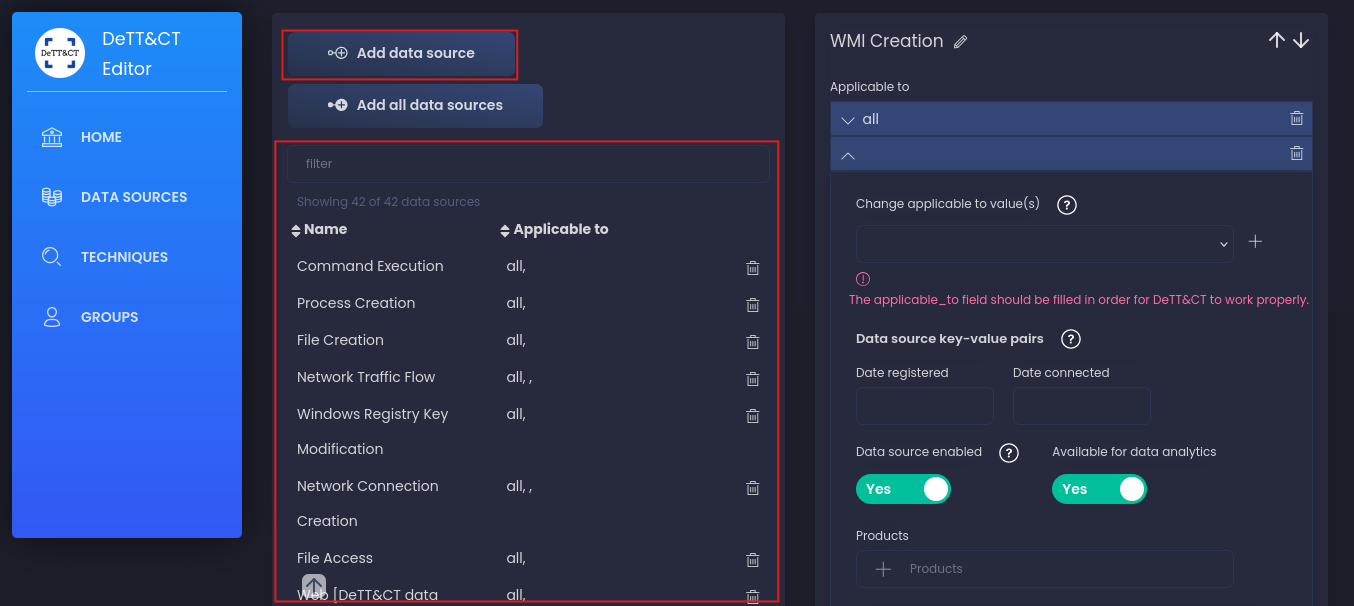
We can add data Manually by the DeTT&CT Web Editor ( or just uploud the yaml file)
1- Open the DeTT&CT Editor in your browser:
2- Click Add Data Source.
3- Enter the data source name (Process Creation, Network Traffic Flow, User Account Authentication,..).
4- Select the platform Windows, Linux, Network, or Cloud.
5- Repeat for all the data sources you’ve collected from the client.
6- When done, click Export YAML to download the generated configuration file.
MITRE ATT&CK Navigator
then convert the data to json file to be able to uploud it on MITRE ATT&CK Navigator using this command:
python3 dettect.py ds -fd '/home/kali/Downloads/data-sources-new.yaml' -l
ds - tells DeTT&CT you want to work with data sources.
-fd - '/path/.yaml' specifies your input YAML (your collected data sources).
-l - prints the list of all MITRE ATT&CK Data Sources + related Techniques that match what you provided.
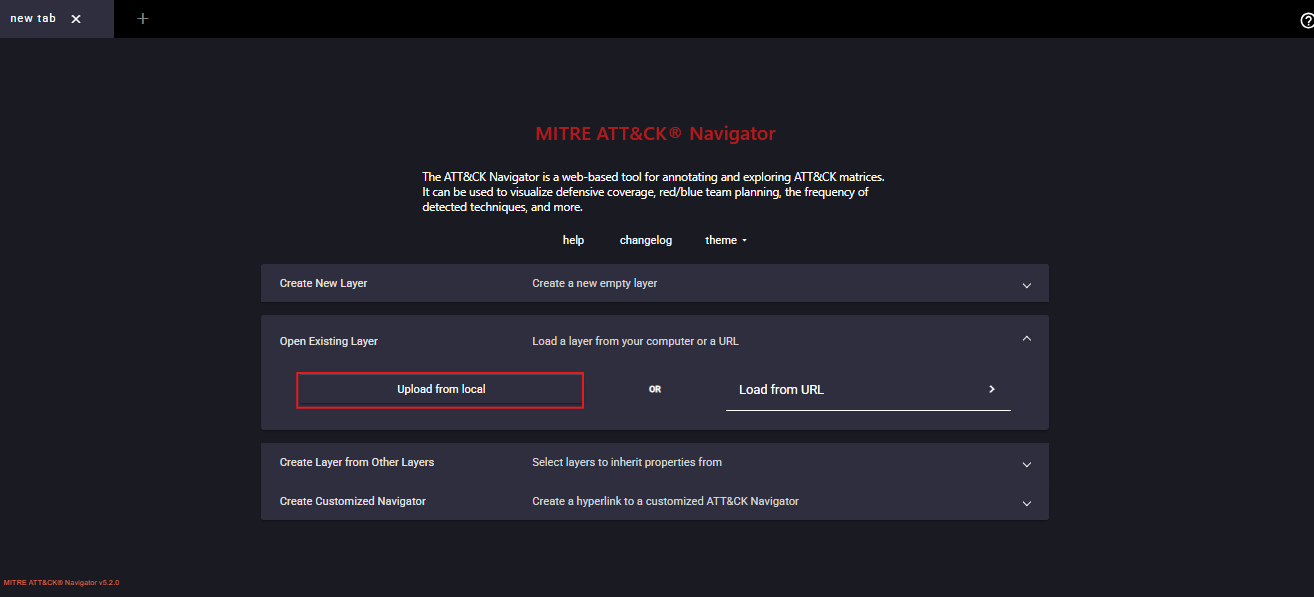
Once you visualize the JSON in MITRE Navigator, you’ll get a color-coded visibility heat map that shows which ATT&CK techniques your current data sources can detect and more importantly, which ones you can’t.
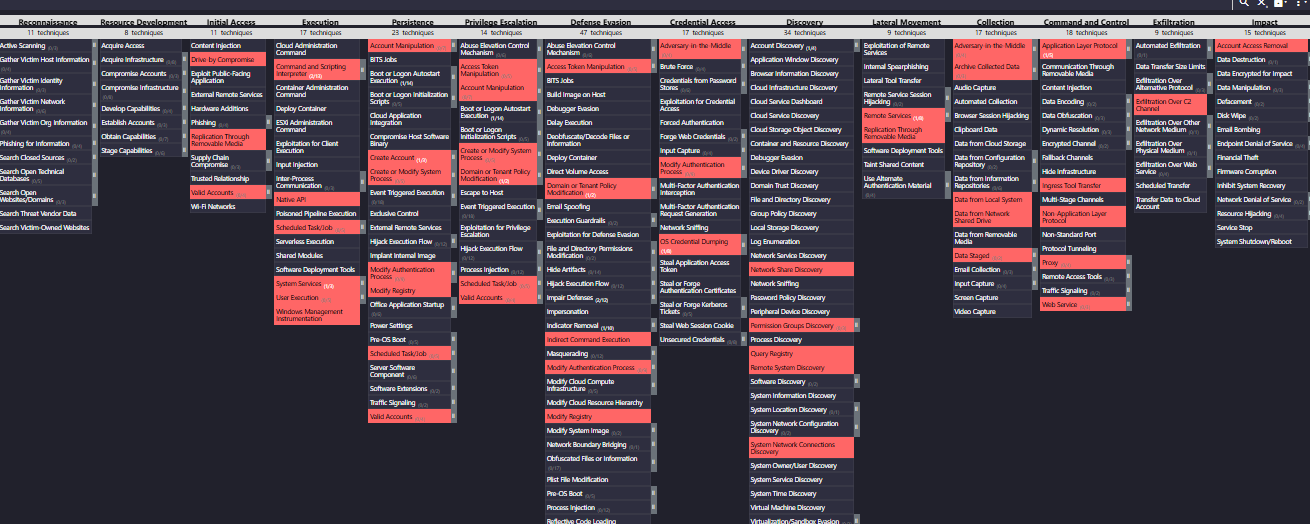
Building a Visibility Heat Map bridges the gap between theory and operational defense. By combining attacker behaviors (from the attacker heat map) with your telemetry reality (from DeTT&CT analysis), you create a strategic detection roadmap.